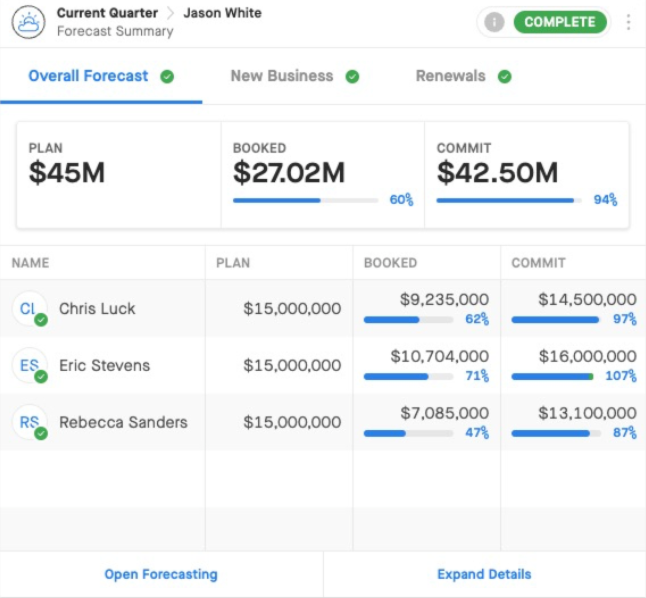
I want a view that shows:
- $ closed-won bookings and % attainment to goal/quota by quarter
- $ closed-won bookings and % attainment to goal/quota for the entire fiscal year
We have 9 account executives and I am confident I can find this data with a ton of clicks and by changing the period and clicking through the small bit of reporting hierarchy we have. I can make it happen via a Salesforce report but I want a dashboard/view that will assemble this essential data for me and look (something) like this:
| Q1 | Q2 | Q3 | Q4 | FY | |
|---|---|---|---|---|---|
| AE #1 | $245K 51% | $15K 15% | $200K 45% | $460K 33% | |
| AE #2 | $0 0% | $100K 27% | $455 102% | $555K 46% | |
| AE #3 | $50K 6% | $550K 145% | $600K 55% |
I can’t be the only sales manager using Clari asking for this so forgive me if this already exists.


