I want a view that shows:

  • $ closed-won bookings and % attainment to goal/quota by quarter
  • $ closed-won bookings and % attainment to goal/quota for the entire fiscal year

We have 9 account executives and I am confident I can find this data with a ton of clicks and by changing the period and clicking through the small bit of reporting hierarchy we have. I can make it happen via a Salesforce report but I want a dashboard/view that will assemble this essential data for me and look (something) like this:

  Q1 Q2 Q3 Q4 FY

AE #1

$245K

51%

$15K

15%

$200K

45%


$460K

33%

AE #2

$0

0%

$100K

27%

$455

102%


$555K

46%

AE #3

$50K

6%

$550K

145%


$600K

55%


I can’t be the only sales manager using Clari asking for this so forgive me if this already exists. 

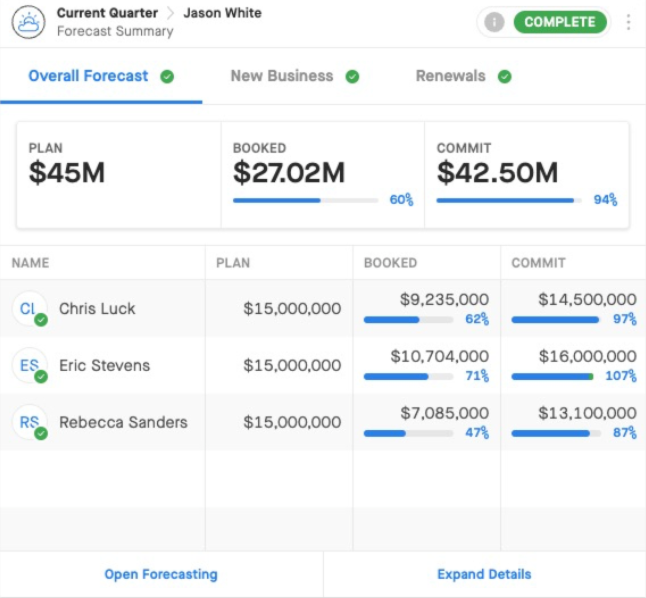
Hi, ​@Timm Ideker! You can use the Forecast Widget to pin a summary of 1 or more tabs from your Forecast Module to a Dashboard. This summary includes the Quota (i.e. Plan), Closed against Quota (i.e. Booked), and the primary forecast call (i.e. Commit) as you have them set up in your forecast tab(s). You can learn more about the Forecast Widget in our knowledge base, but you can pin the summary of the quarter(s) and tab(s) of your choosing in your Dashboard so that you can compare them side by side. Hope this helps!


Thank you for being first to respond ​@Kenna - are you recommending that I would pin 5 x different widgets into a Dashboard - one for each of the 4 quarters and 1 for the Fiscal Year?


Hi, ​@Timm Ideker. The Forecast Widget allows you to select one quarter/fiscal period and 1 or multiple tabs to pin to your Dashboard from the Forecast Module today, so you would need a widget for each quarter that you wanted to view in order to see them side by side in your Dashboard. For example, in the screenshot of the widget above, we’re looking at the CQ and can flip between the Overall Forecast, New Business, and Renewals tabs from our demo instance.


Reply