

The Waterfall analytics module you all know and love is coming to the Forecasting module! This’ll allow you to view the same pipeline movement insights from Waterfall without the additional clicks of having to leave Forecasting.
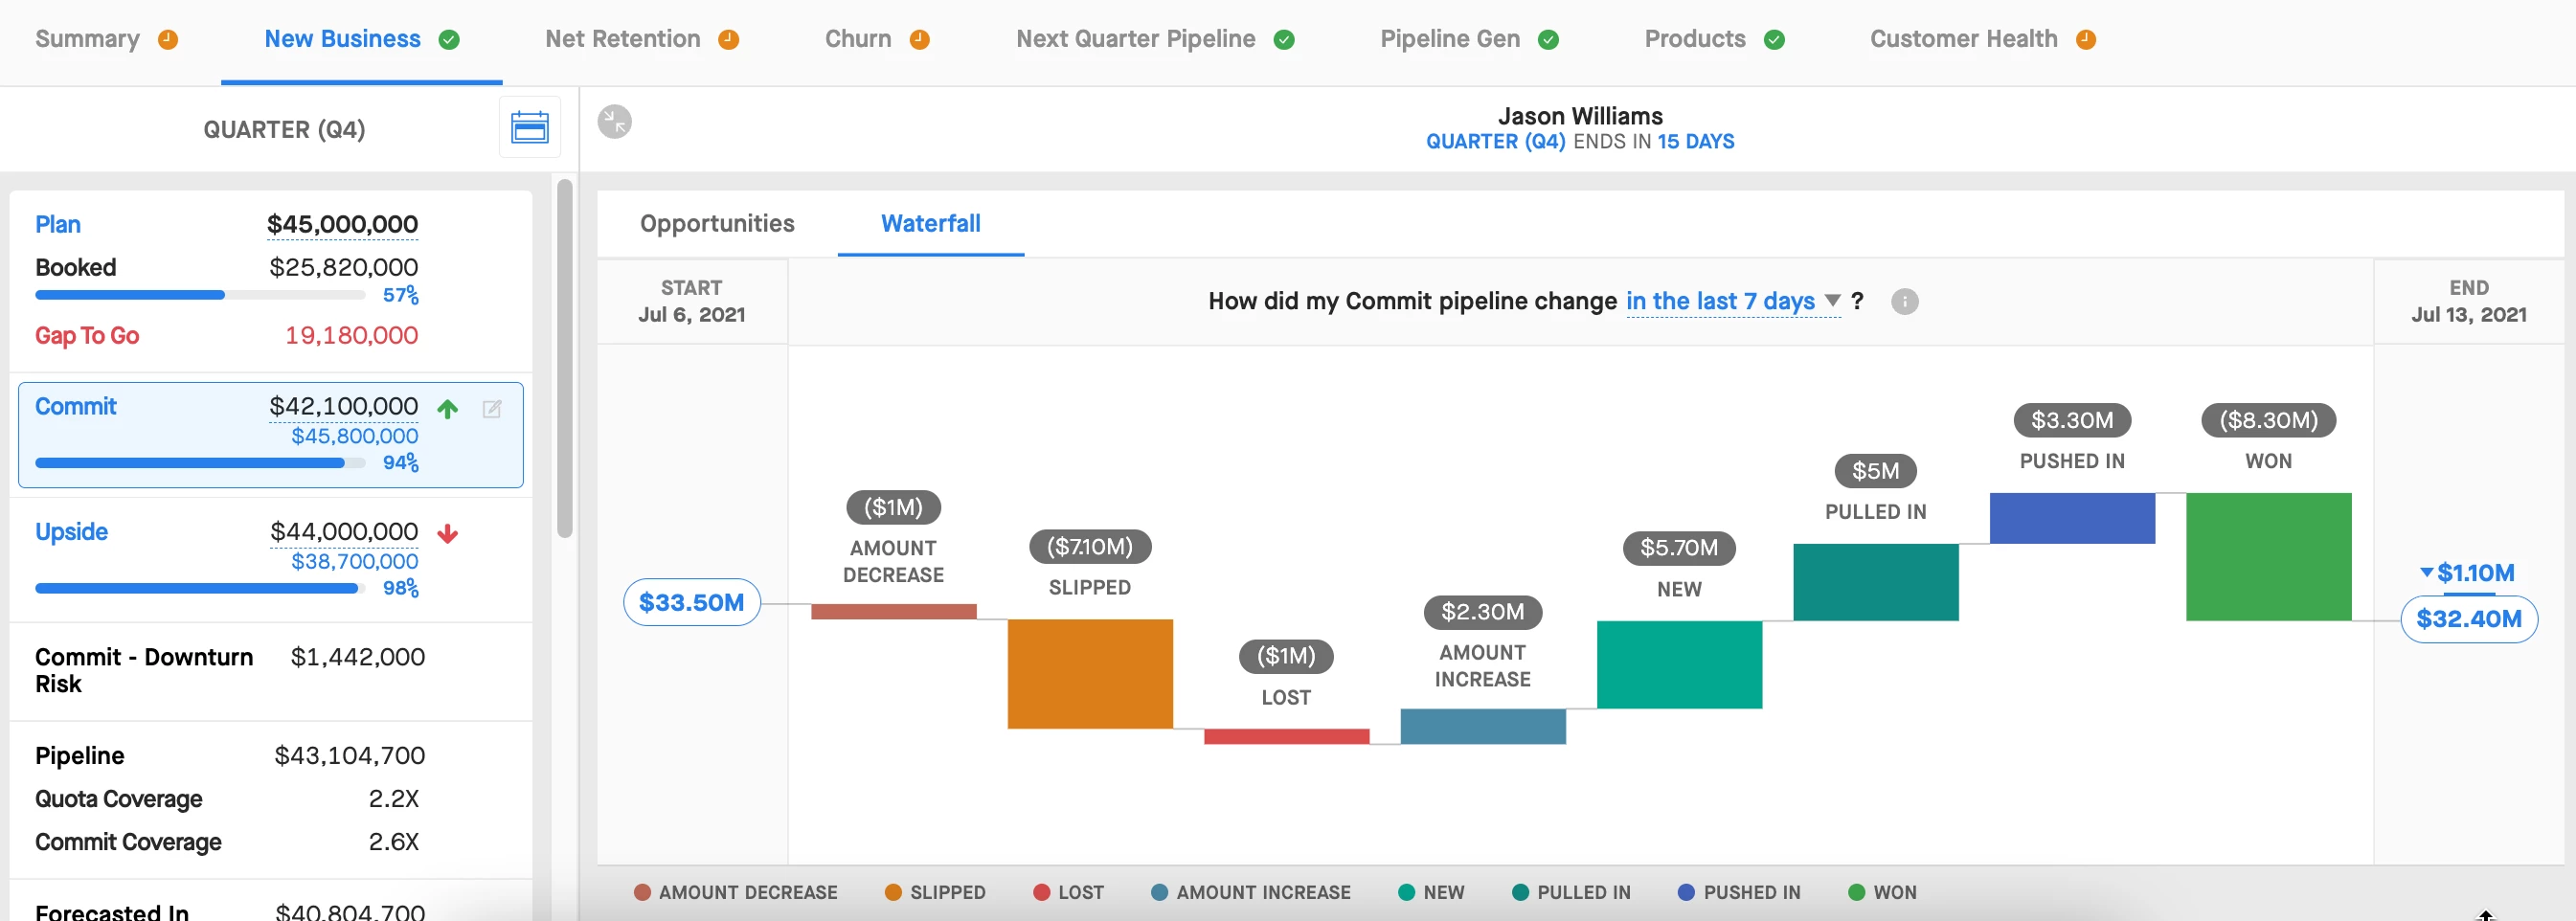
Now you’ll be able to view how your Commit pipeline has changed over a selected time period. These periods include:
- Since The Last Forecast Update
- In the last 7 days
- This Month/Quarter
- Last Month/Quarter
- And even a custom date range!
Quickly understand what deals in your Commit pipeline have
- Decreased in amount
- Slipped out of your current forecasting period
- Filtered out of your Commit category (hint: these are the deals you want to pay special attention to!)
If this sounds like an early access program your organization would like to participate in, please reach out to your CSM to express interest and keep an eye out for the Waterfall in Forecasting EAP Group in the community.