Question

Waterfall-Original vs New Values

  • August 13, 2024
  • 4 replies
  • 97 views

Forum|alt.badge.img+1

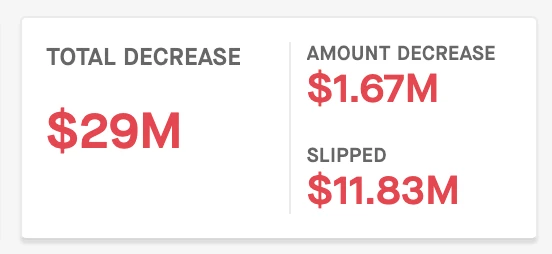
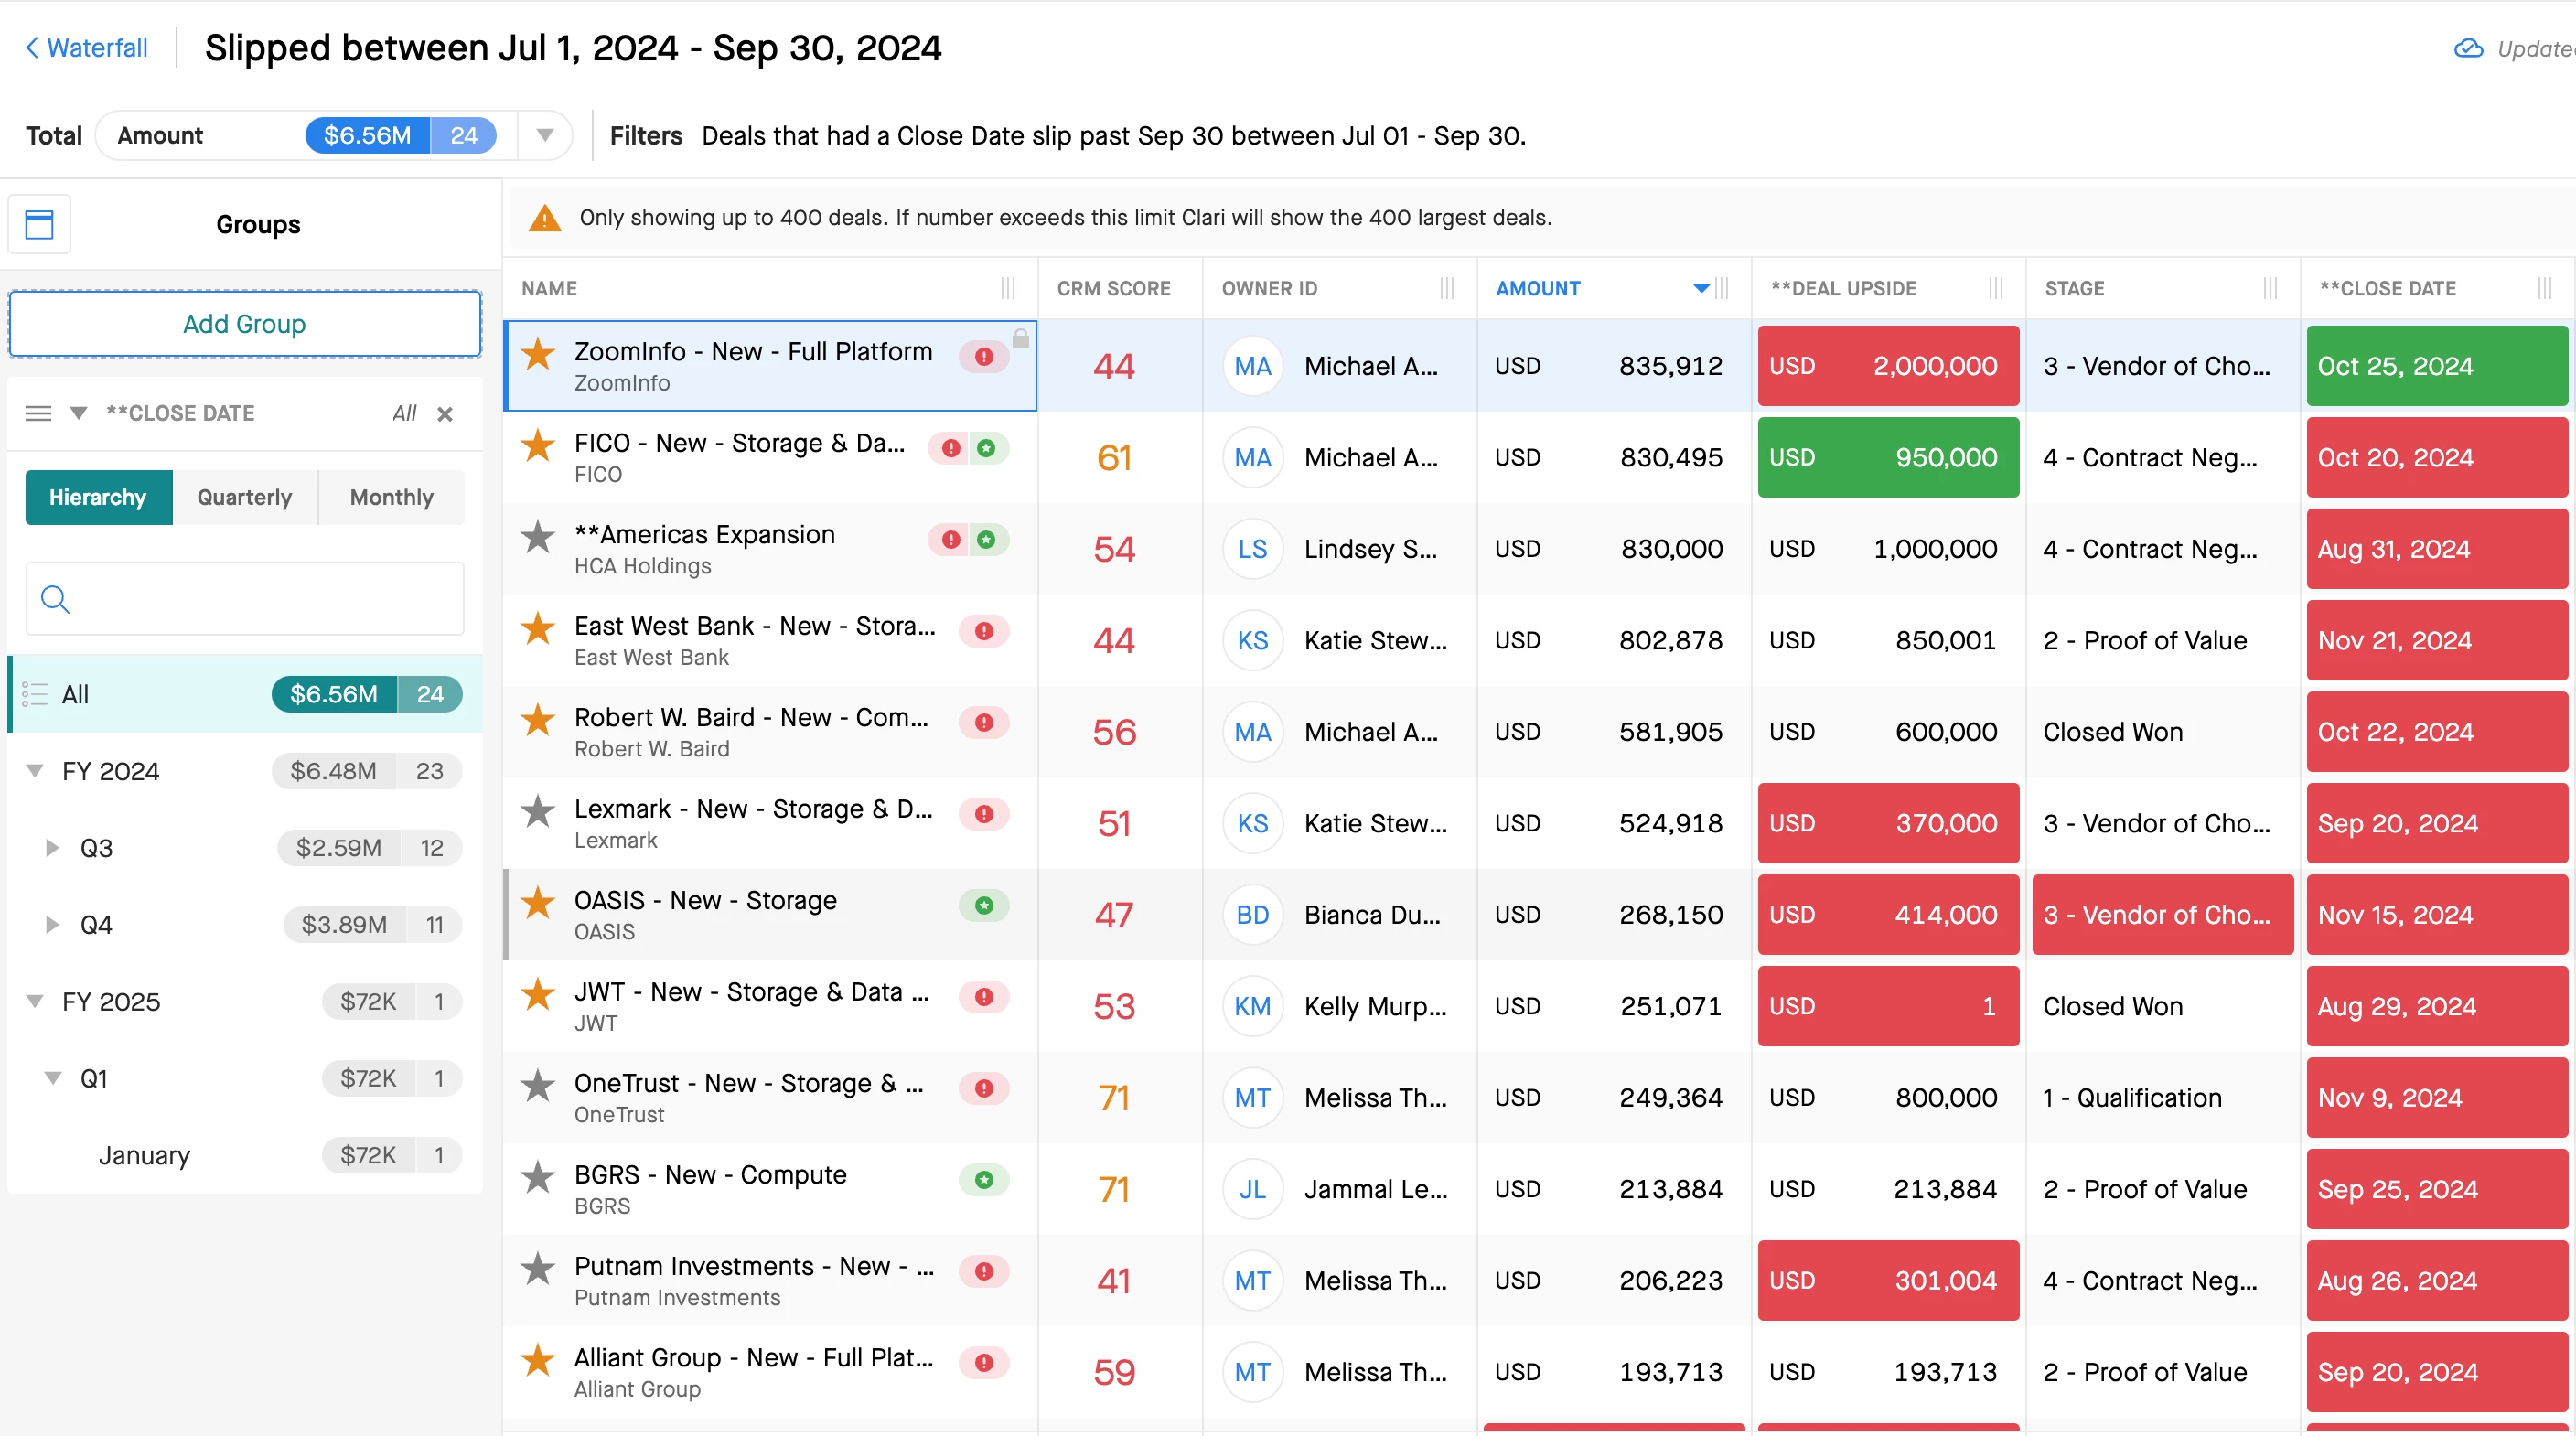
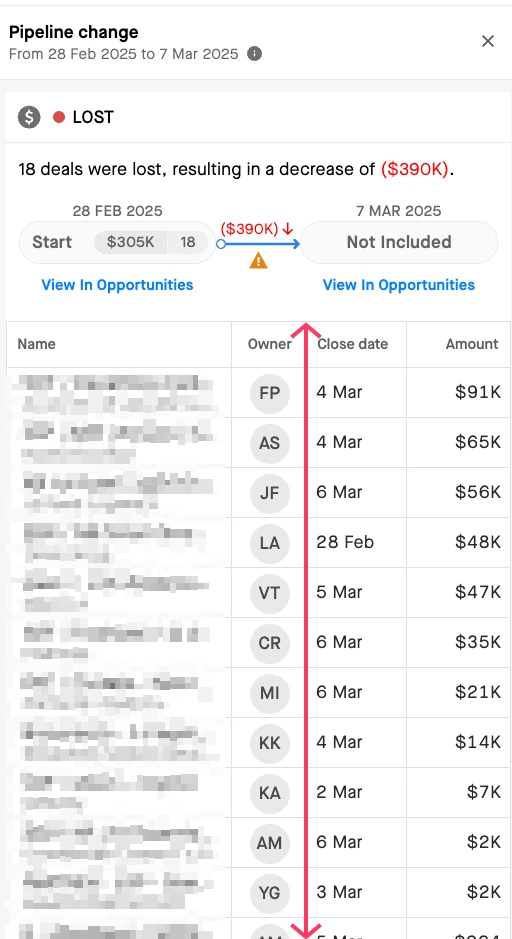
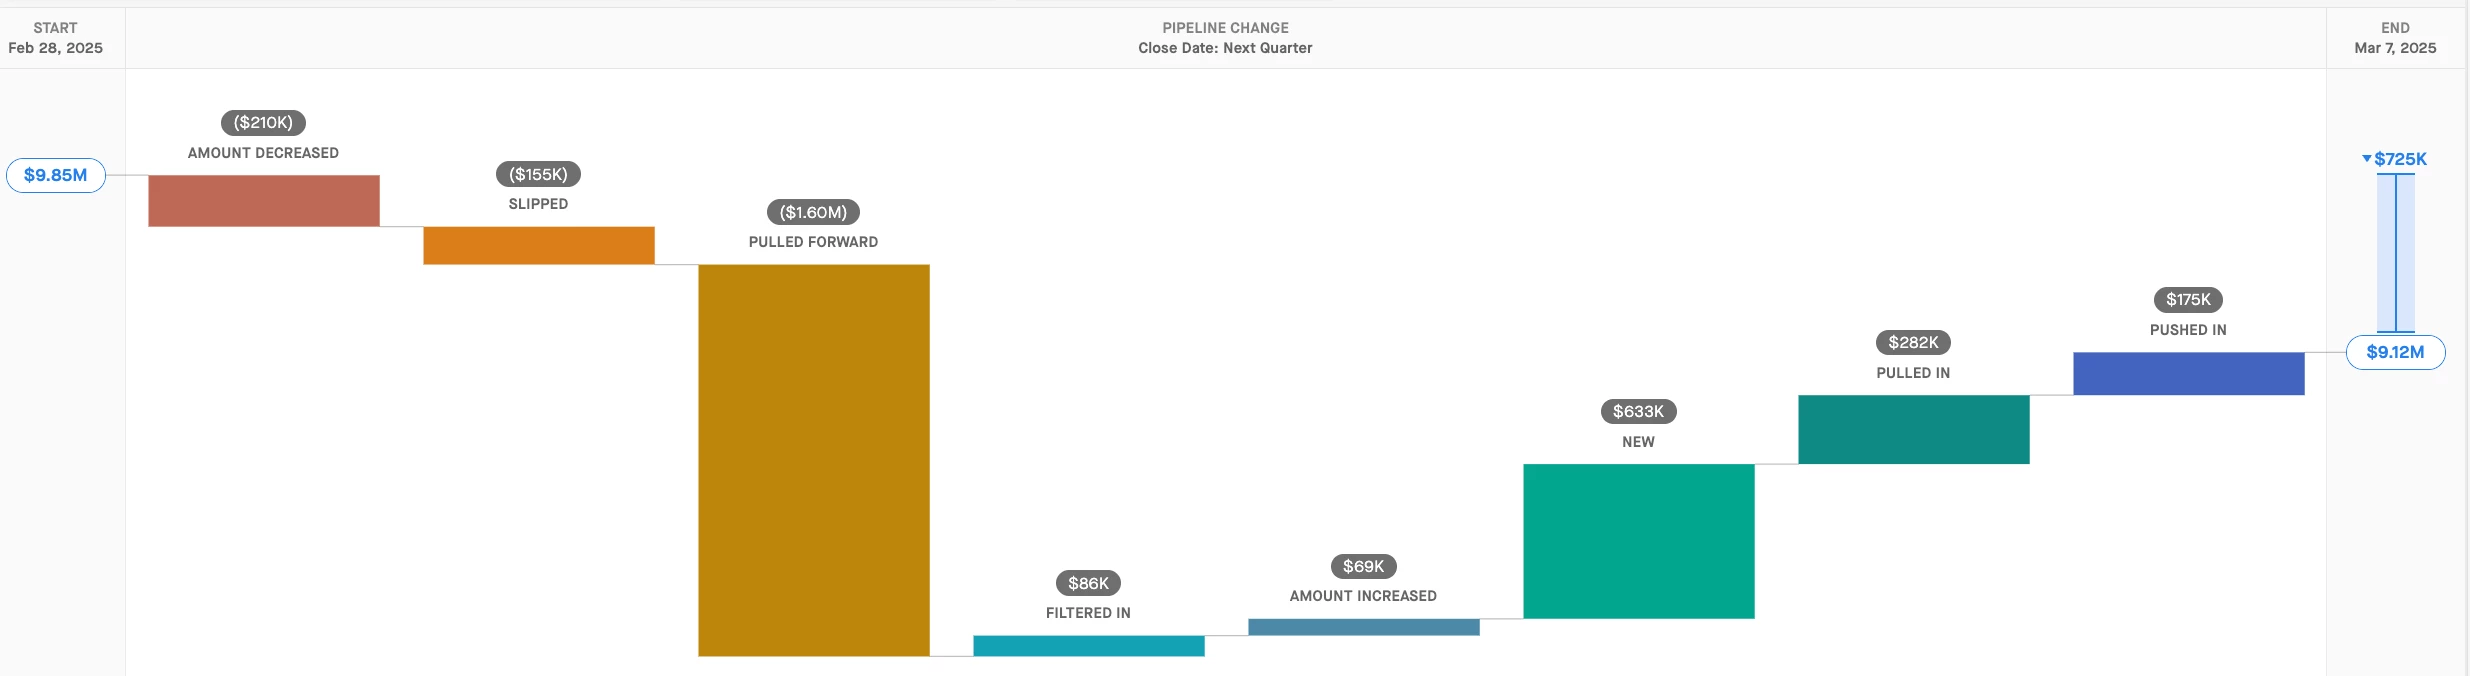
In terms of the "Amount Decreased" widget, I need to hover over the red box to see what the original value was vs the new value. Is there anyway to show both the original value and the new value so I can do an analysis on the amount and not have to hover over the field every time and write down the numbers? The same thing for the "Slipped" view where I want to see the original close date vs the new close date.

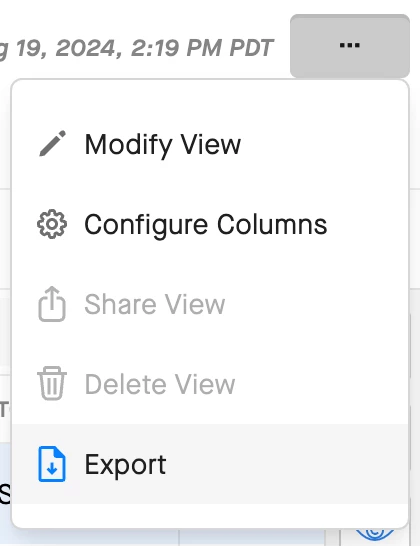
I prefer the above in a view, but can this data be downloaded into a gsheet or excel?

4 replies

Kenna
Community Manager
Forum|alt.badge.img+18
  • Community Manager
  • August 13, 2024

Hi, @Eric Horio ! It sounds like you’re clicking on the Amount Decreased and Slipped categories in Waterfall to open the opportunity Grid. That’s probably the best way to see the details regarding the changes to the individuals deals within that category, but back on the Waterfall page, the KPIs at the top of the chart do calculate not only the overall Amount Decrease in your pipeline, but also break down how much of that was due to deal amounts decreasing and how much of that was due to deals slipping, if that is what you’re after.
 

I can also recommend using the option to add a Group when you click on a category like Slipped. Simply expand the panel on the left side with the icon below (left side of the opp grid):

That’ll allow you to add a group for Close Date, which will help visually break down for you what the close date for these deals that slipped moved to​​​​​​​:


Forum|alt.badge.img+1
  • Author
  • New Contributor
  • August 14, 2024

I can see the total amount that decreased for that category, but I would like to do an analysis on the individual deals in two columns ( Original Value vs New Value ) instead of having to hover over the TCV column. Or is it possible to export that information with the Original Value vs the New Value into a spreadsheet, so I can do some deeper analysis?


Kenna
Community Manager
Forum|alt.badge.img+18
  • Community Manager
  • August 19, 2024

Hi, Eric. Once you’ve clicked on a category, you can export the current information from the opportunity grid using the Export option in the Actions drop-down. 


Unfortunately, this export will not include the previous value entered in the field. You can submit an idea to our Product team for a future enhancement though!


Andrew
New Contributor
Forum|alt.badge.img+2
  • New Contributor
  • March 7, 2025

This is one of the biggest frustrations for me to be fair.

The ability to see the date that the deals have come from and / or gone to is a necessity and something we have to solve for outside of Clari. You must have the data to know that something was in the quarter and is no longer, or was in the future and is no longer, or was at one value and is now at another…


At our company, we auto default the lost date to today. So everything that is closed lost in a future period is shown as pulled in and lost which is wrong.


 so why not surface it in the grid view, or indeed the side panel, as i said, the data must exist.


If I look at next quarter, I always see this lovely big bar which in reality is pulled in a lost. We never get to see a “Lost” next quarter.