


One of the best features in the Opportunity Grid’s the capacity to change the timeframe for highlighted fields. Whether you landed in the Opportunity Grid from an Analytics Module or you are manipulating an existing View, you can quickly adjust how fields are highlighted to ensure you aren’t missing any context around the most important updates that occurred.
It’s a little hidden, so don’t feel bad if you missed it.
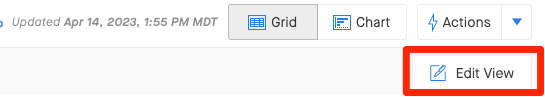
By clicking “Edit View” in the Opportunity Grid, you’ll see an expanded description of the filters being applied, the scope, amount etc. On the right-hand side of that panel, you’ll see the slider (pictured below) that allows you to adjust the timeframe we use for the highlights to your history-tracked columns.
By default, the highlights look at the last 7 days. In addition, to the last 7 days we can also display a timeframe of the last day, the last 14 days, the last 30 days, and the last 90 days.
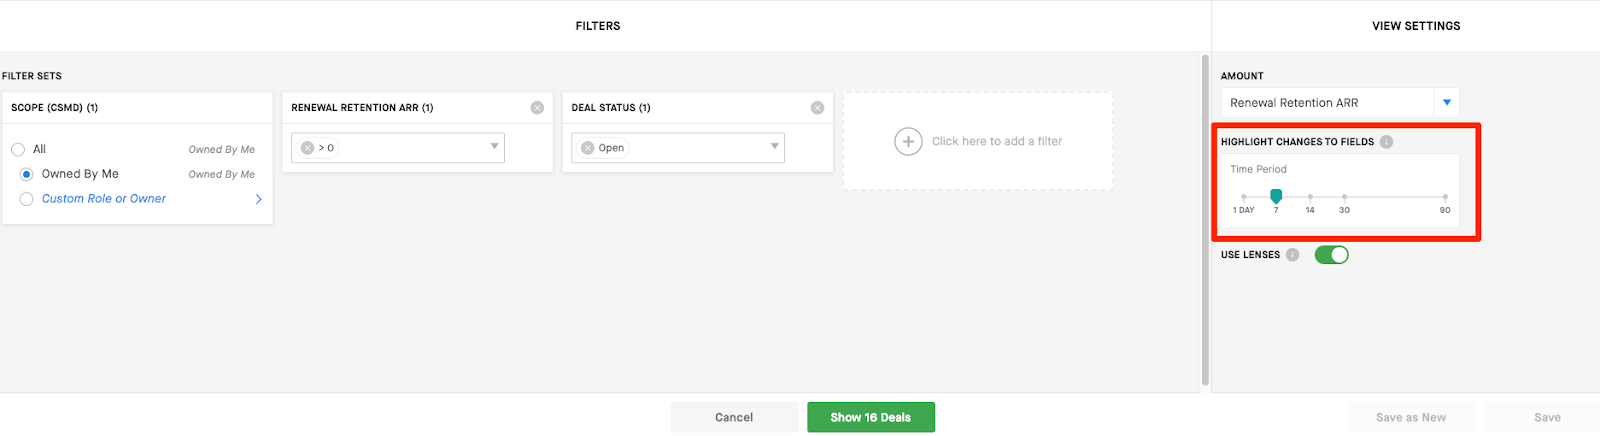
Use the different time frames depending on what insights you are looking for. Towards the end of a quarter, using 1 day is a great way to clearly see where changes occurred. Use the last 30 days option to understand how a month has shaped up. The last 90 days is an excellent way to see which deals may be idle where we don’t see those color changes.
How else do you use the different timeframes?