AMA

Analytics AMA on July 19th!

  • May 18, 2022
  • 11 replies
  • 195 views
Analytics AMA on July 19th!

This is your chance to ask Paige, a Product Specialist, anything about:
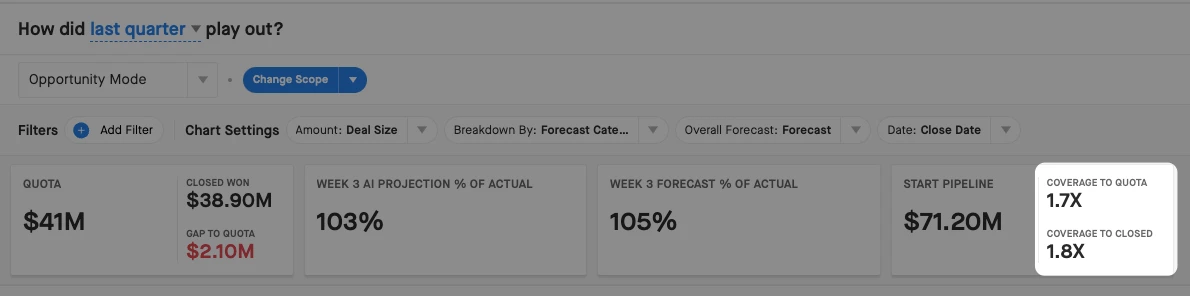
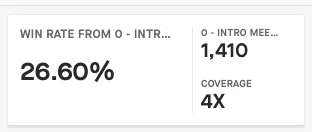
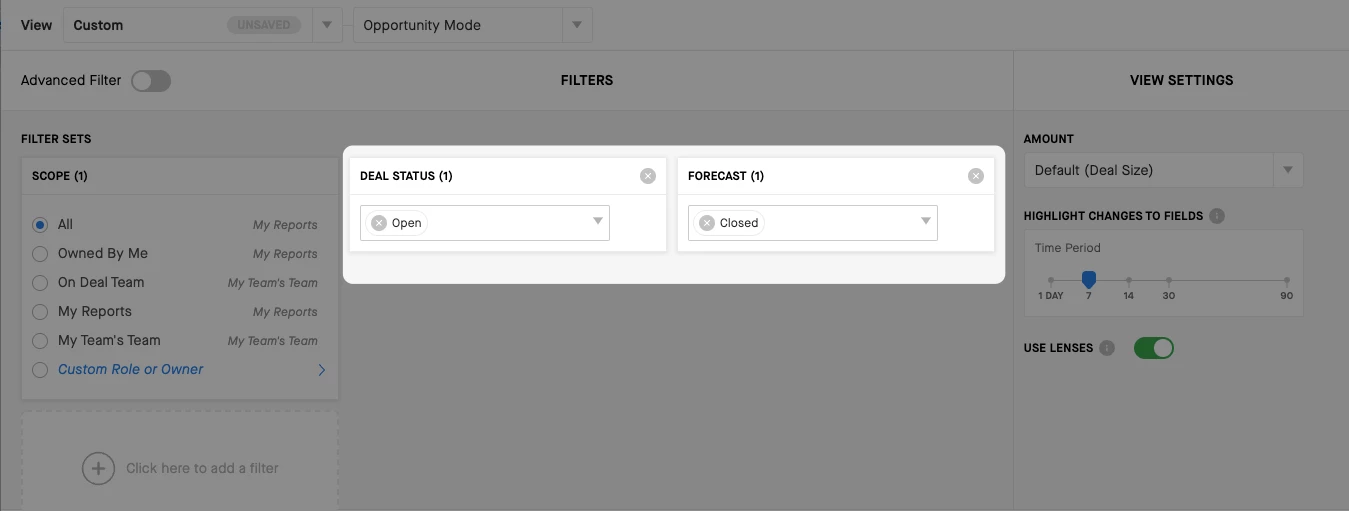
Analytics

AI Projection

Funnel

Waterfall

Trend

Pulse

Flow

Ask Paige questions below & She’ll answer them on July 19th at 1:30pm CST. 

Questions asked prior to July 19th will be guaranteed an answer, so bring them today!

11 replies

canbasher
New Contributor
Forum|alt.badge.img+1
  • New Contributor
  • June 15, 2022

Hi Paige Nice to emeet you!  I was wondering if there are plans to give admins more control on what factors to include/exclude into the prediction by the AI?  I would imagine this could be the ability to exclude Ownership Transfers, New etc from the AI Prediction and not just the trend totals.  Thank you!


icarrazana
New Contributor
Forum|alt.badge.img+1
  • New Contributor
  • June 16, 2022

Hi Paige! 


I have a similar question - how can Clari admins make sure that Clari analytics align to company-specific reporting standards? For example, Gainsight counts pipeline, win, and conversion rates from stage 2 onwards only. 


Relatedly, will there be admin functionality to configure defaults for Clari analytics? Or do we have to ask a CSM whenever we want to set defaults (I think that is the case now)? 


  • Engaged Member
  • July 12, 2022

In Pulse analytics module, we have the ability to toggle on the drop down “How is this quarter shaping up” to Next Quarter (Q+1), Current Quarter, or each of the last 4 historical quarters. The Next Quarter view projections using historical conversion rates and extrapolating out a target coverage level by team within hierarchy is extremely useful/automated and why I know many of us use this module, but we would like to be able to use projections on further quarters (Q+2 at least and ideally to Q+3). While I understand pipe further out can become subject to maturity levels (low levels to start with), it would be nice to build an estimated view of what pipeline levels would be needed to be successful in R4Q perspective. As many of us know, just using 4X or 3X targets is not aligned to each sector of business on varying conversion rates and we want to align more closely to set better expectations.

Is there something Clari can use to help teams project out in a rolling quarter view than just one quarter out?

Regards,

Sean


Hi Paige Nice to emeet you!  I was wondering if there are plans to give admins more control on what factors to include/exclude into the prediction by the AI?  I would imagine this could be the ability to exclude Ownership Transfers, New etc from the AI Prediction and not just the trend totals.  Thank you!


Hi @canbasher 👋! 

While we don’t have plans to allow admins to configure the AI projection model directly, you are able to influence the scope of deals that are factored into how the projection is calculated today. 


For example, users can add a filter in Trend for Deal Type or Record Type to exclude a subset of opportunities (ex. Renewals). As you already know, this would exclude that subset of opportunities (ex. Renewals) from the inventory of deals in Trend. What some users don’t know, however, is that it also excludes that subset of opportunities from the deal that the AI Projection takes into consideration, which influences your historical conversion rates used to calculate the projection. This is the case for any filter(s) that you apply in Analytics and is a helpful way to pressure test Clari’s AI projection.


For an overview of how to adjust your filters in Analytics, check out this article in the Help Center.


Kenna
Community Manager
Forum|alt.badge.img+18
  • Community Manager
  • July 19, 2022

Hi, Paige! I have a question that comes up when users notice in Trend that some historical conversion rates are greater than 100% for certain categories. What would cause this to be the case? ​​​​​​

aTg6UDRBN7h-cOBpZJkX_an5VbKX6iSv_s8CqIS8zIqkbOIBVBjXhZe9AuQ8axgRdVJgwbKmZidt0lLAYG0_nbzfmhHAWlkMiqtpcvCBDyGZ-l-CTKVpdAn1POGACBBzhmhdJ9C_-Y4JT5y8xZ0


Hi Paige! 


I have a similar question - how can Clari admins make sure that Clari analytics align to company-specific reporting standards? For example, Gainsight counts pipeline, win, and conversion rates from stage 2 onwards only. 


Relatedly, will there be admin functionality to configure defaults for Clari analytics? Or do we have to ask a CSM whenever we want to set defaults (I think that is the case now)? 

Hi ​​​@icarrazana, thanks for your question! 

As mentioned above, utilizing Chart Settings is a great way to make sure you’re focusing on the right deals in analytics. For your example, if you want to focus on conversion and win rates for Stage 2 onwards, you can use Funnel. By deselecting earlier stages in the Funnel legend, you can isolate the calculations to just the deals you care about.

In regards to configuring defaults, I’m excited to share that the Clari team is hard at work building saved Views in Analytics, a feature that will allow admins to configure and share saved Views for analytics modules in the same way you can configure and share Views in opportunities today. Expect more information about this feature and how to sign up for early access from your CSM soon!


In Pulse analytics module, we have the ability to toggle on the drop down “How is this quarter shaping up” to Next Quarter (Q+1), Current Quarter, or each of the last 4 historical quarters. The Next Quarter view projections using historical conversion rates and extrapolating out a target coverage level by team within hierarchy is extremely useful/automated and why I know many of us use this module, but we would like to be able to use projections on further quarters (Q+2 at least and ideally to Q+3). While I understand pipe further out can become subject to maturity levels (low levels to start with), it would be nice to build an estimated view of what pipeline levels would be needed to be successful in R4Q perspective. As many of us know, just using 4X or 3X targets is not aligned to each sector of business on varying conversion rates and we want to align more closely to set better expectations.

Is there something Clari can use to help teams project out in a rolling quarter view than just one quarter out?

Regards,

Sean

Hi @Sean Cullen 👋! Thanks for your question.  I touched base with our Product team on this, and we have heard your idea from other customers and definitely understand the desire for this functionality. It’s not something our team is actively focused on developing right now, but we’ve seen customers use Forecasting to track pipeline generation for future quarters. There’s lots of insights in Clari today that can help inform the pipegen that you set and track towards in Forecasting, including your “Coverage to Quota” from Pulse (Last Quarter), and your “Win Rate” from any stage in Funnel (Last Quarter).

Coverage to Quota in LQ Pulse


Win Rate in LQ Funnel

We have a webinar recording that walks through this use case here if that sounds interesting to you! If you think this would be a good use case for Forecasting for your organization, then please don’t hesitate to reach out to your success team at Clari to implement it.


Hi, Paige! I have a question that comes up when users notice in Trend that some historical conversion rates are greater than 100% for certain categories. What would cause this to be the case? ​​​​​​

aTg6UDRBN7h-cOBpZJkX_an5VbKX6iSv_s8CqIS8zIqkbOIBVBjXhZe9AuQ8axgRdVJgwbKmZidt0lLAYG0_nbzfmhHAWlkMiqtpcvCBDyGZ-l-CTKVpdAn1POGACBBzhmhdJ9C_-Y4JT5y8xZ0

This is such a good question, @Kenna! 👌 This can be due to a couple of reasons.

  1. The first possible reason is that a deal increased in value after Clari’s historical snapshot was taken or the deal was won, and that’s because the conversion rate is based on amount. For example, if a single deal was worth $1K at the time it was closed, but later the deal was updated to $1.1K, then Clari would show a 110% conversion rate. 
  2. Another possible reason is that the pipeline a team has at the beginning of the quarter grows due to an increase in deal size before the end of the quarter. This is especially common for teams with a healthy renewal/upsell business. For example, maybe your team has an account up for renewal with a value of $100K at the beginning of the quarter, but by the time the renewal is closing, the account would like to purchase $10k in additional licenses, bringing the total deal value to $110k. In this case, Clari would show a 110% conversion rate.


Kenna
Community Manager
Forum|alt.badge.img+18
  • Community Manager
  • July 19, 2022

Hi, Paige! I have a question that comes up when users notice in Trend that some historical conversion rates are greater than 100% for certain categories. What would cause this to be the case? ​​​​​​

aTg6UDRBN7h-cOBpZJkX_an5VbKX6iSv_s8CqIS8zIqkbOIBVBjXhZe9AuQ8axgRdVJgwbKmZidt0lLAYG0_nbzfmhHAWlkMiqtpcvCBDyGZ-l-CTKVpdAn1POGACBBzhmhdJ9C_-Y4JT5y8xZ0

This is such a good question, @Kenna! 👌 This can be due to a couple of reasons.

  1. The first possible reason is that a deal increased in value after Clari’s historical snapshot was taken or the deal was won, and that’s because the conversion rate is based on amount. For example, if a single deal was worth $1K at the time it was closed, but later the deal was updated to $1.1K, then Clari would show a 110% conversion rate. 
  2. Another possible reason is that the pipeline a team has at the beginning of the quarter grows due to an increase in deal size before the end of the quarter. This is especially common for teams with a healthy renewal/upsell business. For example, maybe your team has an account up for renewal with a value of $100K at the beginning of the quarter, but by the time the renewal is closing, the account would like to purchase $10k in additional licenses, bringing the total deal value to $110k. In this case, Clari would show a 110% conversion rate.

Thanks, @paige_at_clari! Very helpful to know the conversion rate is based on amount.


Kenna
Community Manager
Forum|alt.badge.img+18
  • Community Manager
  • July 19, 2022

Hi, @paige_at_clari ! One more question, if I see 2 Closed rows in Trend, why would this occur?

Z52PqnwyG51DKWLwhKhMZeh3DKI1psBSJG5g8L_Kkgpfcn93wni4Awwos4DvSVuYDCp35OFaYyyXUVbTk0-jwyR8TD6_i6RRqGv8gFgjpYOcMRQxbAPPSzGC_VCVpAVHGzt44vf_d4j7f4ockrI


Hi, @paige_at_clari ! One more question, if I see 2 Closed rows in Trend, why would this occur?

@Kenna great question! This occurs if deals are in a “Closed” forecast category, but their deal status  is “Open” according to the stage (i.e. the forecast category is Closed, but the stage is S2 - Validation). You can verify which deals fall into this category by going to the Opportunities tab and filtering on deals that are in a Closed forecast category but have a Deal Status equal to Open.