


Dashboards are one of my favorite modules in Clari because it acts like a Swiss army knife 🇨🇭🗡 and brings in insights from Clari’s other modules. Here’s a tip below on Top Deals Widgets.
Top Deals Widget 💡
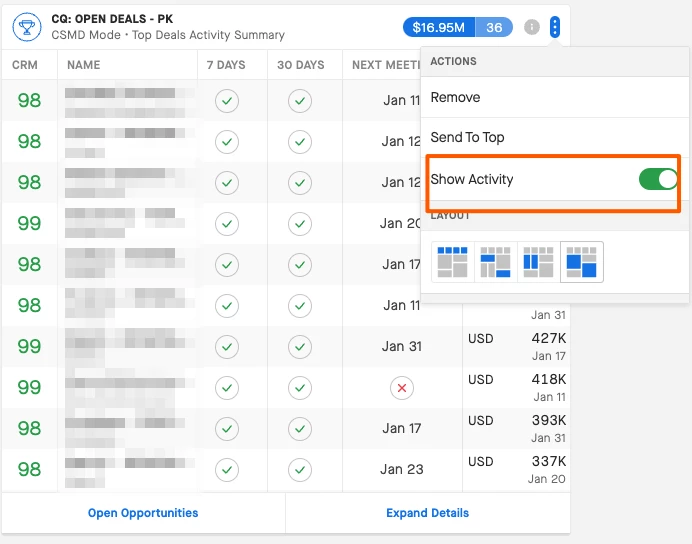
Did you know that you can show activity over the past 7-30 days for your top deals widgets? All you have to do is click on the 3 dots in the upper right hand corner and select ‘Show Activity’. Not only will this show you activity summary, but you can check to see if a next meeting is scheduled from a birds eye view.
Bonus: KPI Widget 💎
What’s better than one dashboard tip? Two dashboards tips! That’s right, because knowledge is power. When you create a KPI Widget, I recommend using the right arrow to show not only the Total Amount, but the number of Deals and Average Deal size as well.
What catches a lot of people by surprise is that you can actually click any area within the dotted boxes to change the fields shown within the KPI Widget. For instance, you can change Average Deal Size to Average Deal Age.
Hope that was helpful and cheers to 2023! 🎉